Optimising front-end WordPress Performance
If you have used tools like Pingdom, Google PageSpeed Insights or GTmetrix, you will have seen that they can help you work out why the ‘front-end’ performance of your site is slow.
Front-end performance covers everything that happens in the user’s browser. It does not include things like PHP execution time or MySQL query time, which come under back-end performance.
Front-end performance includes:
- Static file loading speed
- Static file sizes
- Blocking JavaScript
- JavaScript that is heavy on CPU
Solutions that help improve front-end performance include:
- Image and static file compression (Brotli or gzip)
- Serving images in modern formats such as WebP and AVIF
- Minification of files (remove comments and whitespace, rename variables to one or two character names)
- Using a CDN to serve static files quickly from a location near the user
- Loading JavaScript files asynchronously or deferring them
- Removing or optimising JavaScript code that is heavy on CPU
Older guides told you to spread static files across several domains so browsers could download them in parallel. Under HTTP/2 and HTTP/3 that advice is obsolete. A single connection now multiplexes many files at once, so sharding across domains just adds DNS and TLS overhead. Serve everything from one host or your CDN instead.
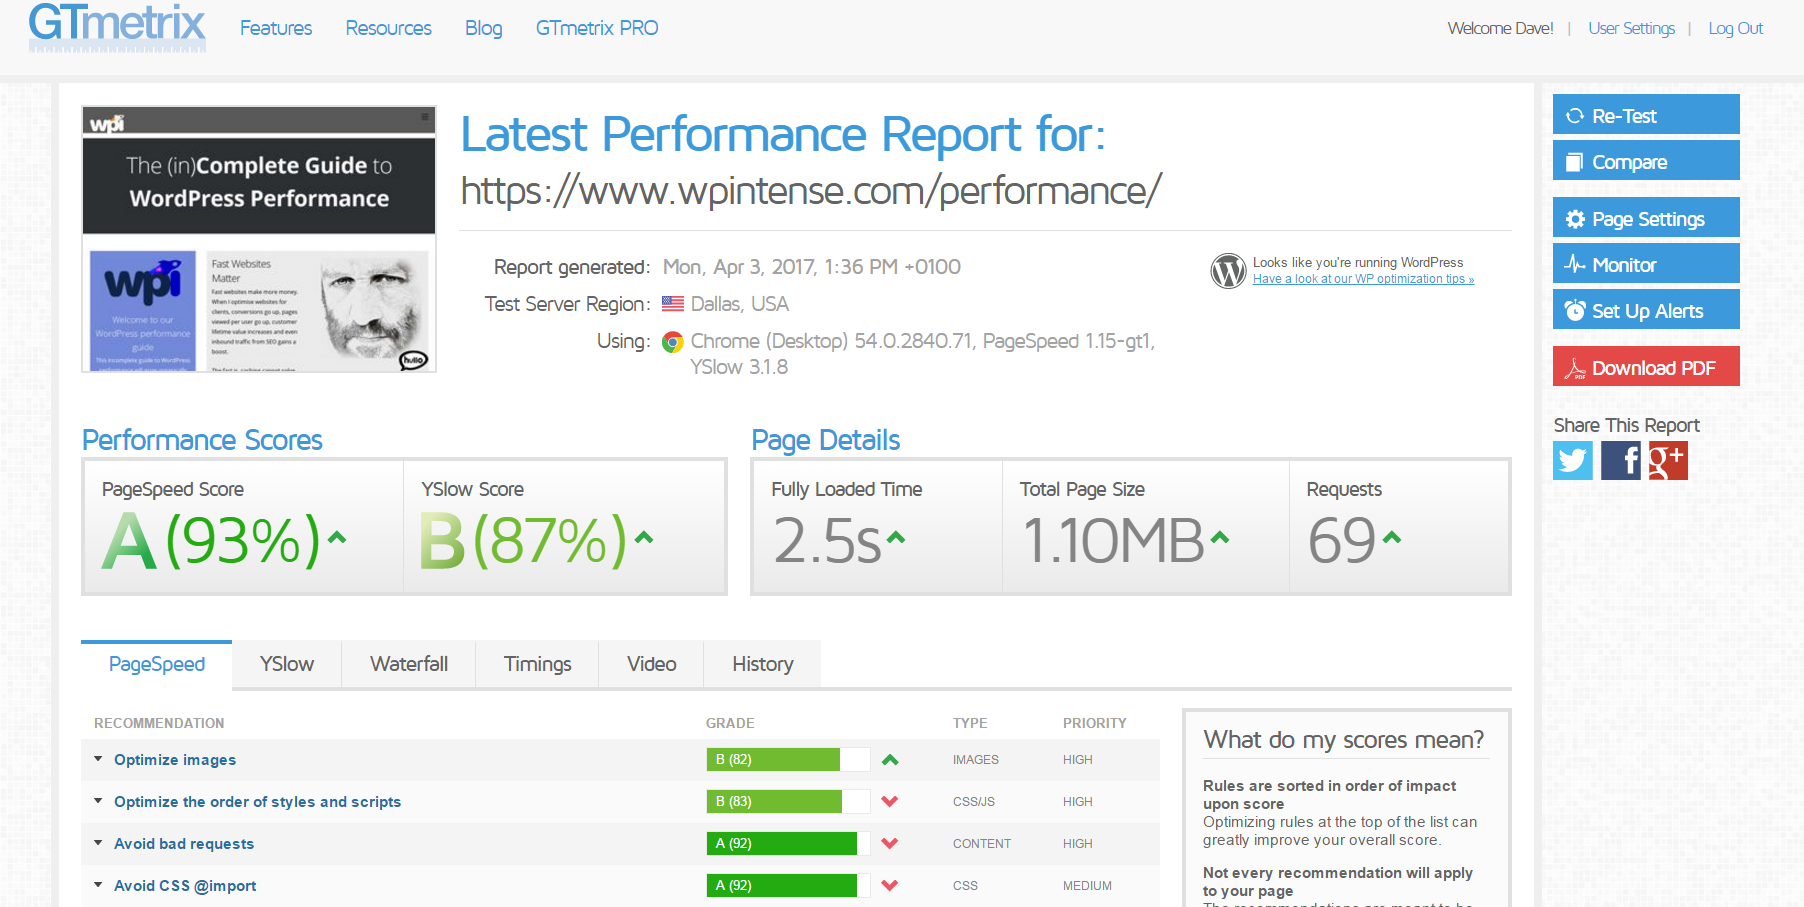
Here is how a GTmetrix report looks for our site:
How to optimise your site yourself
Here are the steps I typically take.
Image compression
Smush is a solid WordPress plugin for this job, but nothing beats compressing and optimising an image yourself before you upload it. The free version of Smush lets you bulk compress images, and the pro version adds automatic WebP conversion and is not too pricey.
Better still, serve your images in modern formats. WebP is supported by every current browser and AVIF is supported by all the major ones, and both are far smaller than the equivalent JPEG or PNG. Most caching and image plugins can generate these formats for you automatically.
Alternatively, you can use Cloudflare’s paid image optimisation to compress your images for you.
You will also find that these front-end speed analysers penalise you if you have resized images downwards using CSS. I personally think that is too harsh, because there are solid reasons to do it. You might load a large image into a smaller box so you can offer the user a zoom option, or you might be serving images from elsewhere and cannot control the size.
I can see why they penalise it, but I think they penalise it far too much.
WordPress adds loading=lazy to images below the fold automatically, so off-screen images no longer block the initial render. Just make sure you are NOT lazy-loading your main hero or LCP image, as that delays the very thing the page is judged on.
Browser caching
You can configure this at the nginx or .htaccess level, but plugins like W3 Total Cache and WP Rocket simplify it for you. You want the browser to cache static files for as long as possible (one year).
The free Cloudflare plan also lets you set up browser caching of static files very easily, so you may not need a plugin to handle this at all. See Configuring Cloudflare for WordPress and WooCommerce for the settings I use.
There is also a plugin that removes version numbers from static file URLs. Be careful with it. It will boost your score in GTmetrix, but depending on your theme you may find that browsers keep serving stale files after you update your code. If that happens it is easy enough to deactivate the plugin to restore the version numbers.
Static file compression
To save bandwidth for your users, you can enable compression for the CSS, JavaScript and HTML sent to the browser. Brotli is now the standard choice and compresses text better than gzip, with gzip kept as the fallback for anything that does not support it.
Note that compressing files uses CPU on your server, so it is not always a given that you want to compress everything. Test it and see. In practice Brotli and gzip are cheap enough that the bandwidth saving almost always wins.
You can also use Cloudflare to compress and optimise your assets, or if you are using our Rocket Stack, all static files are automatically compressed at the operating system level if they are not already.
W3 Total Cache has built-in tools for this too, and the Rocket Stack ships with nginx configured to compress every kind of static file.
It is good practice to set the Vary: Accept-Encoding header in your nginx configuration so that caches store the compressed and uncompressed versions separately. The front-end analysers will flag it if it is missing.
Fix render-blocking JavaScript
W3 Total Cache has tools to help here, but depending on the plugins you are using they can cause issues.
A free plugin dedicated to fixing this is Autoptimize. Install it, configure it to defer or async your JavaScript, and your site will load faster. WP Rocket and FlyingPress do the same thing if you already use one of those. Personally I use W3 Total Cache to achieve the same result.
Minification of files
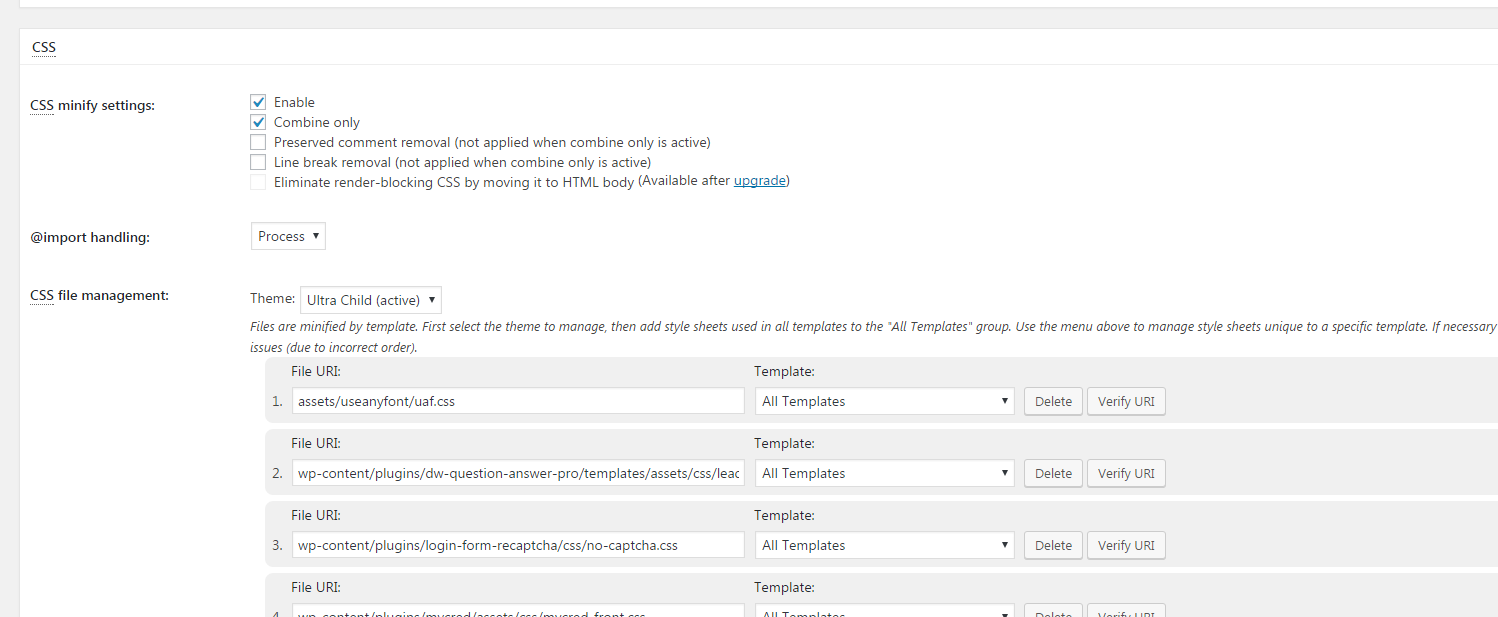
This is a problematic area. Almost every minification approach I have tried causes bugs somewhere. The safest approach that still gives a performance boost is to use the following settings in W3 Total Cache:
- Combine only, set to on. This combines files without minifying them.
- @import handling, set to Process. This speeds up font imports a little. If you load web fonts, see Using Custom Fonts On Your WordPress Site.
Testing everything
I use GTmetrix to test front-end performance. It gives you clear, in-depth information about how to solve each issue. GTmetrix now bases its scores on Google Lighthouse, the same engine behind PageSpeed Insights, so the two broadly agree.
Bear in mind this only covers front-end performance. These tools cannot help you with slow responses from your server. For slow server responses, take a look at our Scalability Pro plugin and our Rocket Stack, and read How to Identify and Fix Scalability Issues on your WordPress Website.
Be careful how you interpret GTmetrix, PageSpeed Insights and Pingdom scores
Each of these tools has its own algorithm for giving your site a ‘speed’ score. (YSlow, which used to be popular for this, has been discontinued and is no longer maintained.)
You need to be aware that they are not truly measuring speed. They are measuring a bunch of things that frequently correlate with speed. For example:
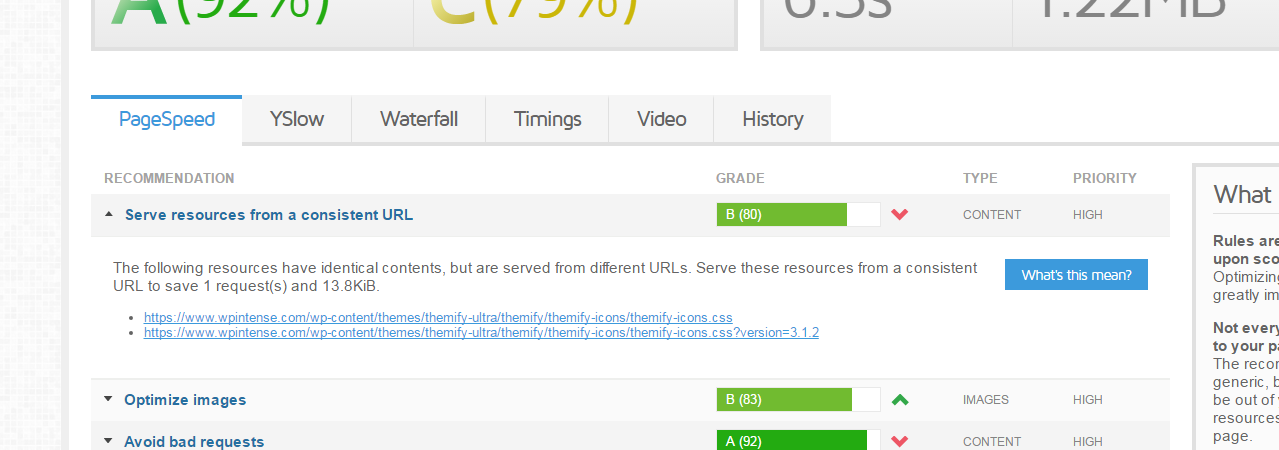
Notice the B grade of 80% for serving the same file twice. This file is tiny, around 3KB. Loading it twice causes no real performance problem, yet the tool applies a serious penalty.
They frequently over-penalise other harmless configurations in the same way.
Bear in mind what really matters for performance:
- Your users need to be able to load your pages quickly.
- Google needs to be able to load your pages quickly, and to form a good impression of your site.
These days Google measures the real-world experience through Core Web Vitals: Largest Contentful Paint (LCP) for loading, Cumulative Layout Shift (CLS) for visual stability, and Interaction to Next Paint (INP) for responsiveness, which replaced First Input Delay in 2024. Those are the numbers that feed into ranking, so they matter more than a letter grade.
Chase Core Web Vitals (LCP, CLS and INP) measured on real visitors, not the letter grade a synthetic test gives you. A green set of Core Web Vitals is what Google actually rewards, and it lines up far better with how fast the site feels to a real person.
The single most critical factor on most WordPress sites is server-response time, yet GTmetrix and the like do not penalise you much for a slow server. The page above had a server-response time of 323 milliseconds. When I artificially increased it to 20 seconds, I did not get a lower score.
Twenty seconds is obviously far too long for a customer to wait, but none of these front-end analysers really care about that.
Chasing a perfect front-end score while your server takes seconds to respond. A slow LCP is almost always caused by a slow back end (a high Time To First Byte), and no amount of image compression or JavaScript deferral will fix that. Sort the server out first.



Comments