Super Speedy Performance Analysis
Find which plugin is actually making your site slow, with proof
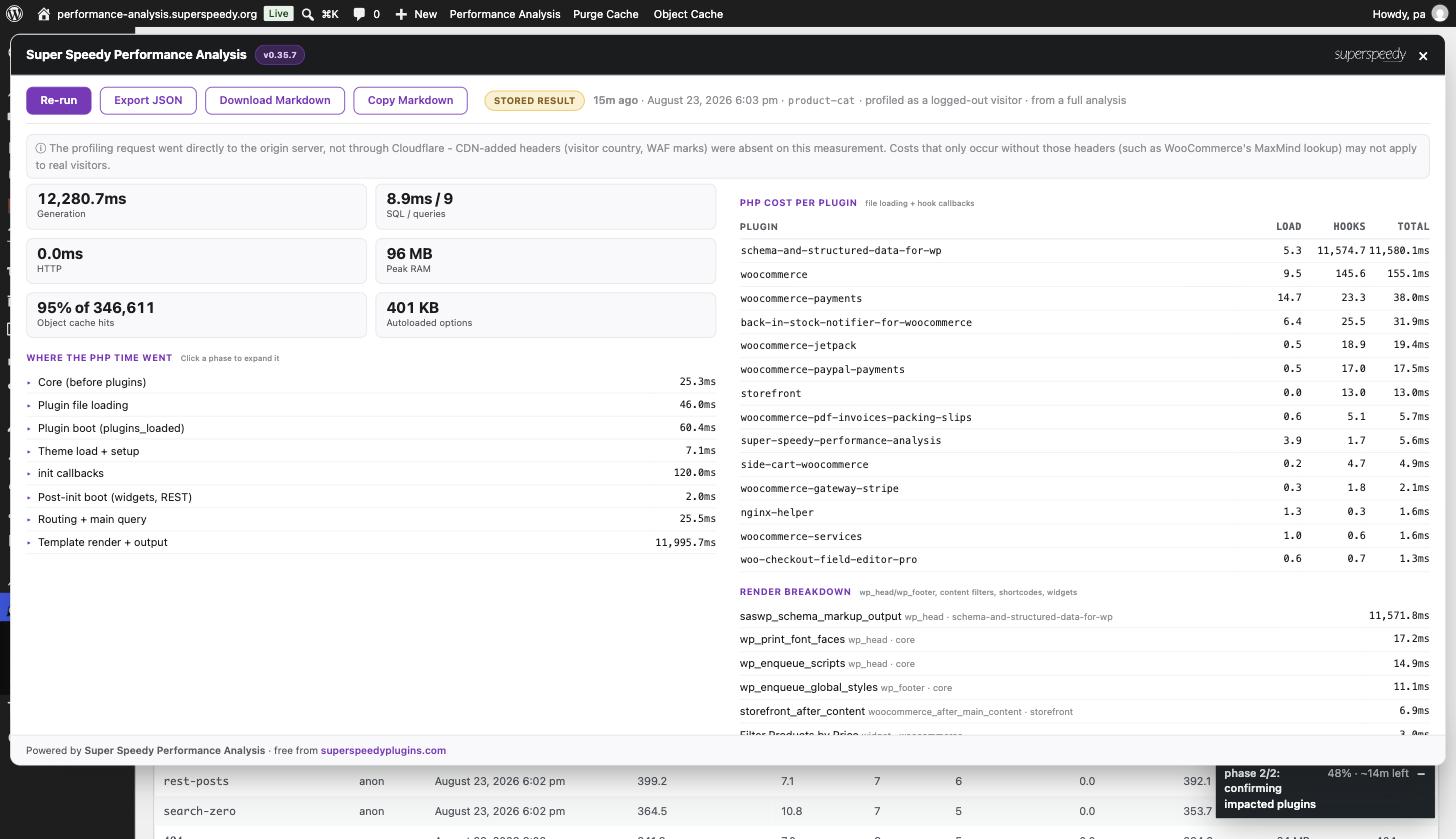
Most performance tools tell you the site is slow. This one names the plugin, the page and the milliseconds, then proves it by measuring again with that plugin switched off for its own test requests. Free, no licence key, and your visitors always get the complete site.

Every profiler gives you another list. This one proves the cause.
See the slow page, the plugin responsible and the measured difference when that plugin is removed from the test request.
The category page takes seconds to load, the dashboard crawls, and someone has emailed to say the checkout hung. Something on the site is doing it, and you have dozens of plugins active.
So you do what every guide says. Build a staging clone, install a profiler, sort the queries by time, then switch plugins off one at a time and reload. An afternoon later you have a suspect and no proof, because the clone holds a fraction of the products and none of the traffic. Doing it on the live site instead is not an option on a shop taking orders.
Super Speedy Performance Analysis runs the experiment on the real site. It profiles the key pages, names the plugin and its cost in milliseconds, then re-runs the same page with that plugin removed from its own test request only. The result is a measured before-and-after figure you can use to fix the problem, challenge the plugin author or remove the plugin with confidence. Visitors always get the complete site, and no plugin is ever really deactivated.
What Performance Analysis gives you back
- A name, not a suspicion. Every finding says which plugin or theme is responsible, on which page, and what it costs in milliseconds.
- Proof you can act on. Measured impact comes from disabling the plugin and re-measuring, so it survives an argument with the plugin’s author.
- The checkout nobody has ever watched. A real purchase timed step by step, split at the moment the money is taken, then the order screen afterwards.
- The slow save explained. WordPress saves over ajax and reloads, so a slow save hides in a request nothing watches. This profiles the write itself.
- Plugins that make the site faster, credited. A plugin that saves time is reported as a saving rather than written off as no impact.
- Permission to cache for logged-in customers. The cookies and nonces blocking a shared cache, named, with ranked candidates for what sets each one.
- An answer on a cached site. Every profiling request is signed and cache-busted, so a page cache cannot answer it and fake a good result.
- Honesty about what it could not measure. A page a cache served is reported as unmeasured, and SQL time it could not capture is stored as unknown rather than zero.
- A site that is never changed by being measured. Suspects are disabled for the test requests only, activation routines are silenced, and destructive statements are refused during a measurement.
- Something to hand to a developer. Any result exports as one privacy-safe Markdown document with the SQL literals and identifiers stripped out.
What you have at the end of a run
A named plugin, a named page, and a number in milliseconds that came from measuring the page with that plugin in and then with it out. The queries behind it, and what the database says is wrong with each one. The function inside the plugin that spent the time. A note of anything the run could not measure, rather than a gap you have to take on trust. Enough to open a ticket with the plugin’s author, or to make the call yourself.
What it measures that other tools do not
Trust the result, even when plugins share code
Plugins bundle the same libraries as each other all the time. Freemius, Action Scheduler, Guzzle and anything else that lands in a vendor directory. PHP loads exactly one copy, and which plugin owns that copy on disk is decided by load order rather than by whose work it is. Attribute by file path, as profilers generally do, and one unlucky plugin gets charged for every other plugin’s use of that library.
Performance Analysis records the whole chain of components behind every query, walks past the shared library and charges the plugin that called in, while still naming the library so you can see where the work happened. A plugin using its own bundled library is still charged for it, and an ordinary call into another plugin’s API still resolves to whoever owns that API.
It matters less than it looks, and that is worth saying plainly. The headline number on the Plugins tab comes from disabling a plugin and re-measuring, which is immune to the whole question. Attribution is a hypothesis. Measured impact is the experiment.
Key features
- Site score out of 100 with the findings that matter most, each naming the component responsible.
- Analyse this page from the admin bar, on the front end or in wp-admin, with the result stored and re-openable.
- Two attribution views, whose code ran and who asked for the work, switchable with nothing re-profiled.
- Queries in loops named properly, including when one plugin’s queries run inside another plugin’s code.
- Query shapes that hurt: postmeta scans, SQL_CALC_FOUND_ROWS, ORDER BY rand(), leading-wildcard LIKE and nested taxonomy joins.
- Autoloaded options that no profiled page read, with copy-and-paste SQL to switch them off.
- Blocking HTTP calls during render, with the host and the plugin that made them.
- Object cache modes: each plugin measured with the cache off, priming and warm, so you can see who depends on it.
- Theme cost, measured by swapping to a stock theme for the test requests only.
- Dependency groups: plugins that cannot run without another are measured together rather than skipped.
- Browser transport for sites where a firewall or Basic Auth stops the server fetching its own pages.
- History of score, findings and median generation time across runs, so you can watch the site get slower as it grows.
- The measurement path disclosed, including whether the request passed through Cloudflare, because a loopback can bypass a CDN.
- Server capability detection that writes the exact install commands for your operating system, PHP version and package manager, and installs nothing itself.
- Opt-in community results at superspeedy.org, anonymised, with the payload shown to you before anything is sent.
Why choose Super Speedy Performance Analysis
Documentation and development
Super Speedy Performance Analysis Knowledge Base
View full Knowledge Base →What's new in Super Speedy Performance Analysis?
View full changelog →- Shared analyses now describe what kind of site this is – an online shop, a jobs board, a publisher, or honestly more than one of them – with the signals that led to the label, so superspeedy.org can compare your results against sites genuinely like yours instead of a single average.
- Site sizes are shared as bands and never exact counts, and now cover pages, total orders, orders in the last 30 days, comments and how many plugins are active, alongside the posts, products, users and database size already sent. Order counts use safe routes only: total orders come from WooCommerce's own order table estimate or WordPress's maintained count, and from nothing at all on a posts table too large to count cheaply, while the 30-day figure is a real count of that window and stays accurate however busy your shop is.
- A checkout analysis now shares your order-management time – opening the order and marking it completed – as its own record with its own total. It was measured but discarded on the way out before. Customer checkout totals are unchanged and still contain no admin time.
- A management sequence that was blocked by a security plugin, or that only got half way, is shared as blocked or partial rather than quietly left out.
- The Share tab now describes all of this in plain terms: what the bands mean, and that checkout and order management travel separately.
- When a plugin reacts to another being excluded for measurement – trying to switch a plugin on or off, or to run a destructive database statement – you are now told, with an admin notice naming the plugin that reacted and the plugin it reacted to. Every attempt was already refused; now you find out even if the analysis finished while you were elsewhere.
- Reactions get their own block on the Overview tab instead of competing for a top-five slot they always lost, and read as plain English ("Rank Math Pro tried to deactivate a plugin while Rank Math was excluded for measurement") rather than a rule name.
- Shared analyses now carry which plugin was excluded alongside which plugin reacted, so these pairs can build a community dependency map. The refused statement itself is still never shared, only its fingerprint.
- Fixed the SEO plugin slug in the bundled rules (Rank Math installs as seo-by-rank-math), so a Rank Math site is correctly spotted when a second SEO plugin is also active.
Questions
Requires Plugins header, and fragile security plugins, are not excluded. If an isolated test still produces a fatal response, the run treats that as dependency evidence, splits the test group and continues rather than presenting the failed request as a performance result.Get it Free
Free download. Install in seconds.

Reviews
There are no reviews yet.